
In a sentence — trace value from first demand to customer outcome, stage by stage, so waste and risk hiding inside a single team's process become visible across the whole chain.
A process map drawn one team at a time almost always misses the hand-off where the real damage happens. This tool starts from the customer's demand and follows it all the way through, so delay, waste and risk that live between teams — not just inside them — get written down somewhere. It's the cross-functional, end-to-end view — broader than D1's detailed map of a single service; use D1 for exactly how one stage works, D3 for where it sits in the whole chain.
There's no scoring or status tracking here by design — this sheet is for building a shared, accurate picture, not for chasing one. The Constraint Analysis and prioritisation instruments do the deciding; this one does the seeing.
WHY THIS HELPS
‘Waste / rework’ has a specific meaning here: work that adds nothing the customer would recognise as value — duplicated effort, correcting an avoidable error, waiting that was designed in rather than genuinely necessary. Naming it is what makes it possible to remove in TO-BE design, rather than leaving it invisible inside an activity that looks perfectly normal on paper.
HOW THIS FEEDS D1 AND D2
This sheet and D1 answer different questions at different altitudes. D1 asks ‘exactly how does this one stage work, minute by minute’ — useful once you already know which stage matters. D3 asks ‘where in the whole chain, from first demand to customer outcome, does the damage actually sit’ — useful before you know that yet. Walk D3 first if you're not sure which stage deserves D1's level of detail; the Waiting/delay, Waste/rework and Risk introduced columns, read across all the rows together, are usually where a constraint candidate for D2 first becomes visible — a stage where several of those columns are non-trivial at once is a stronger candidate than one where a single column looks bad in isolation.
D3 · Value Chain Analysis — the blank tool
Ready to complete for your own engagement. Blue-tinted cells are for you to fill in.
Worked example
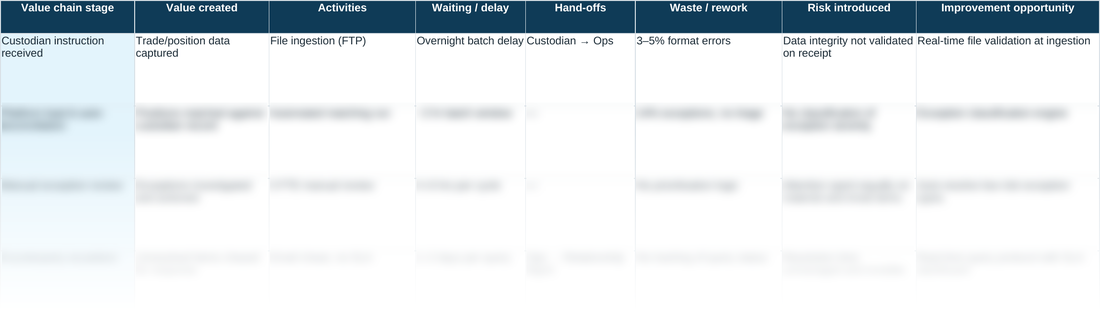
The same tool completed end to end, using the fictional Meridian Wealth Management scenario — see what ‘done’ looks like before you start your own.
A quick walkthrough of the sheet:
Need the full method, not just one step?
All eleven instruments — D1 through D10 and the Prioritisation Matrix — at a discount against buying them separately.