
In a sentence — test a proposed future state criterion by criterion, so ‘automated’ and ‘actually fixed’ don't quietly become the same thing.
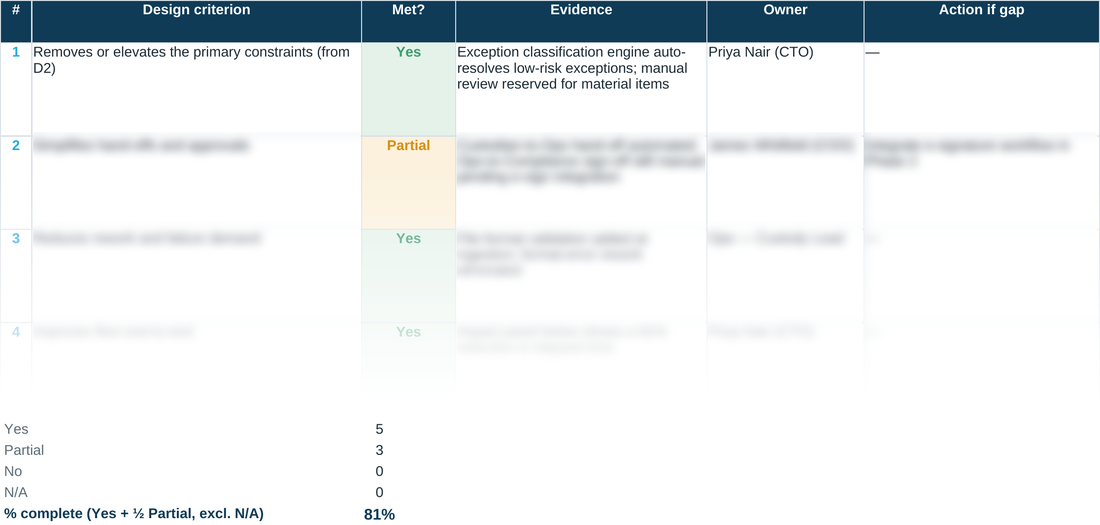
A future-state design can look finished and still carry every risk the current state had — just faster. This checklist tests the design against explicit, named criteria rather than a general sense that things have improved, and it won't let a criterion pass without evidence and an owner attached to it.
Its AS-IS baseline reads live from the D1 tab included alongside it, so the improvement it reports — touch time, elapsed time, flow efficiency, risk count — is a real comparison against what you actually measured, not a target set independently of the diagnosis.
WHY THIS HELPS
Partial and No both require an action, not just a note. It's easy to write ‘mostly there’ and move on; this sheet won't let a gap sit unassigned, because an unassigned gap is the one that reappears eighteen months later.
READING THE IMPACT PANEL
Elapsed time, touch time and flow-efficiency improvement aren't scored the same way, and it matters. For elapsed and touch time, the reduction shown is 1 minus (TO-BE target ÷ AS-IS baseline) — a straightforward percentage cut, so entering a TO-BE elapsed time of 8 hours against an AS-IS baseline of 91.5 hours reports a 91% reduction. Flow efficiency is different: because it's already a percentage, the panel reports the plain difference in percentage points (TO-BE minus AS-IS), not a percentage of a percentage — going from 8% to 29% is a +21 point improvement, not some compounded ratio. High-severity risk count is a plain subtraction. A number that refuses to move even though the checklist above reads mostly Yes is the panel telling you the design has probably worked around the constraints rather than removed them — worth a second look at D2 before the Step 6 gate, not after it.
D4 · TO-BE Design Checklist — the blank tool
Ready to complete for your own engagement. Its AS-IS baseline reads live from the D1 tab included alongside it.
Worked example
The same tool completed end to end, using the fictional Meridian Wealth Management scenario. Its own D1 baseline (worked) tab feeds it the same way.
A quick walkthrough of the sheet:
Need the full method, not just one step?
All eleven instruments — D1 through D10 and the Prioritisation Matrix — at a discount against buying them separately.