
In a sentence — score operational capability across ten dimensions on the same 1–5 scale, so a baseline, a target and an evidenced result can all be compared honestly.
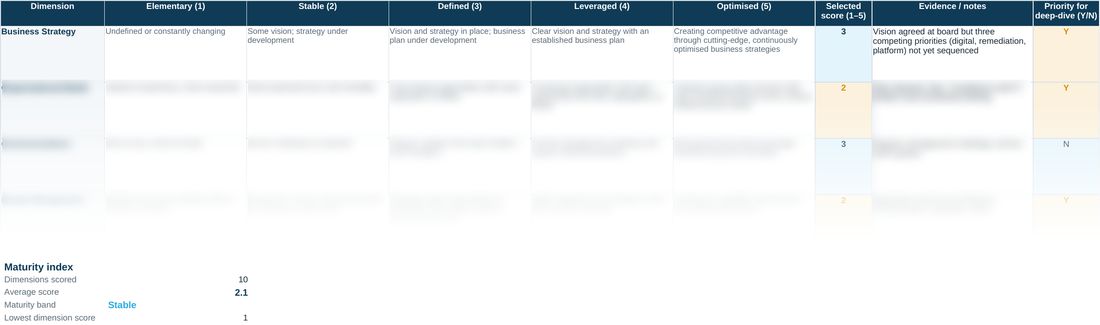
A capability assessment is only useful if the same ten dimensions get revisited with the same scale later — otherwise ‘we've improved’ is just an impression. This tool is designed to be used repeatedly against the same instrument: baseline at Step 2, diagnostic lens at Step 3, re-scored at Step 9 and again at Step 10 as evidence of embedded change.
Scores are directional by design, not precision measurements — the sheet asks for evidence in the notes column specifically so a score can be challenged and defended, rather than trusted just because it's a number.
WHY THIS HELPS
Read the average score and the lowest dimension score together, not the average alone — a strong average can hide one badly lagging dimension that will bottleneck the whole transformation if it isn't flagged for a closer look. Priority for deep-dive is a separate flag from the score itself for exactly this reason.
READING THE MATURITY BAND
The average score maps to a band on fixed thresholds: below 1.5 is Elementary, below 2.5 is Stable, below 3.5 is Defined, below 4.5 is Leveraged, and 4.5 and above is Optimised — the same five labels as the level descriptions themselves, so a 2.1 average genuinely means ‘Stable’ in the same sense the column headers use the word, not a vague approximation of it. Because the band is driven off an average across ten dimensions, it's easy for it to look more reassuring than the underlying spread actually is — a firm with five dimensions at 3 and five at 1 lands on exactly the same 2.0 average, and the same Stable band, as one with all ten sitting evenly at 2. Those are very different transformations to plan. That's the whole reason the Lowest dimension score sits directly under the band: it's the one number on this sheet that a healthy-looking average can't quietly absorb.
D9 · Operational Maturity Model — the blank tool
Ready to complete for your own engagement. Blue-tinted cells are for you to fill in.
Worked example
The same tool completed end to end, using the fictional Meridian Wealth Management scenario — see what ‘done’ looks like before you start your own.
A quick walkthrough of the sheet:
Need the full method, not just one step?
All eleven instruments — D1 through D10 and the Prioritisation Matrix — at a discount against buying them separately.